
A Glimpse of Gladstone Cap's Earnings Potential
Gladstone Cap (NASDAQ:GLAD) is preparing to release its quarterly earnings on Monday, 2025-11-17. Here's a brief overview of what investors should keep in mind before the announcement.
Analysts expect Gladstone Cap to report an earnings per share (EPS) of $0.51.
The market awaits Gladstone Cap's announcement, with hopes high for news of surpassing estimates and providing upbeat guidance for the next quarter.
It's important for new investors to understand that guidance can be a significant driver of stock prices.
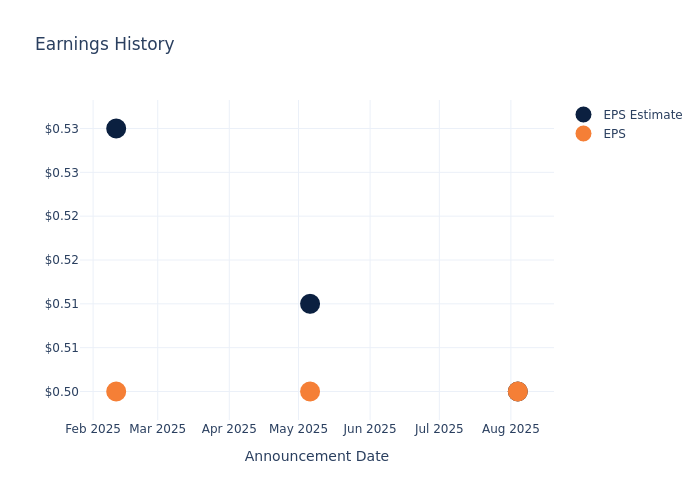
Historical Earnings Performance
During the last quarter, the company reported an EPS missed by $0.00, leading to a 0.71% drop in the share price on the subsequent day.
Here's a look at Gladstone Cap's past performance and the resulting price change:
| Quarter | Q3 2025 | Q2 2025 | Q1 2025 | Q4 2024 |
|---|---|---|---|---|
| EPS Estimate | 0.5 | 0.51 | 0.53 | 0.53 |
| EPS Actual | 0.5 | 0.50 | 0.50 | 0.50 |
| Price Change % | -1.0 | 0.00 | 0.00 | 0.00 |
Stock Performance
Shares of Gladstone Cap were trading at $19.42 as of November 13. Over the last 52-week period, shares are down 26.85%. Given that these returns are generally negative, long-term shareholders are likely bearish going into this earnings release.
Analyst Observations about Gladstone Cap
For investors, staying informed about market sentiments and expectations in the industry is paramount. This analysis provides an exploration of the latest insights on Gladstone Cap.
The consensus rating for Gladstone Cap is Neutral, derived from 1 analyst ratings. An average one-year price target of $25.5 implies a potential 31.31% upside.
Comparing Ratings with Competitors
In this analysis, we delve into the analyst ratings and average 1-year price targets of and Vinci Compass Investments, three key industry players, offering insights into their relative performance expectations and market positioning.
Comprehensive Peer Analysis Summary
In the peer analysis summary, key metrics for and Vinci Compass Investments are highlighted, providing an understanding of their respective standings within the industry and offering insights into their market positions and comparative performance.
| Company | Consensus | Revenue Growth | Gross Profit | Return on Equity |
|---|---|---|---|---|
| Vinci Compass Investments | Buy | 86.48% | $213.07M | 3.58% |
Key Takeaway:
Gladstone Cap ranks at the bottom for Revenue Growth and Gross Profit, but at the top for Return on Equity among its peers. The Consensus rating for Gladstone Cap is not provided in the data.
All You Need to Know About Gladstone Cap
Gladstone Capital Corp is an externally managed, closed-end, non-diversified management investment company. Its investment objectives are to, achieve and grow current income by investing in debt securities of established businesses that would provide stable earnings and cash flow to pay expenses, make principal and interest payments on its outstanding indebtedness, and make distributions to stockholders that grow over time; and provide its stockholders with long-term capital appreciation in the value of its assets by investing in equity securities of established businesses that can grow over time to permit it to sell its equity investments for capital gains.
Gladstone Cap: Financial Performance Dissected
Market Capitalization Analysis: Reflecting a smaller scale, the company's market capitalization is positioned below industry averages. This could be attributed to factors such as growth expectations or operational capacity.
Revenue Challenges: Gladstone Cap's revenue growth over 3 months faced difficulties. As of 30 June, 2025, the company experienced a decline of approximately -62.44%. This indicates a decrease in top-line earnings. When compared to others in the Financials sector, the company faces challenges, achieving a growth rate lower than the average among peers.
Net Margin: Gladstone Cap's net margin is impressive, surpassing industry averages. With a net margin of 97.22%, the company demonstrates strong profitability and effective cost management.
Return on Equity (ROE): Gladstone Cap's ROE stands out, surpassing industry averages. With an impressive ROE of 1.56%, the company demonstrates effective use of equity capital and strong financial performance.
Return on Assets (ROA): Gladstone Cap's ROA surpasses industry standards, highlighting the company's exceptional financial performance. With an impressive 0.96% ROA, the company effectively utilizes its assets for optimal returns.
Debt Management: The company maintains a balanced debt approach with a debt-to-equity ratio below industry norms, standing at 0.59.
To track all earnings releases for Gladstone Cap visit their earnings calendar on our site.
This article was generated by Benzinga's automated content engine and reviewed by an editor.