
Omnicom Group's Earnings: A Preview
Omnicom Group (NYSE:OMC) will release its quarterly earnings report on Tuesday, 2025-10-21. Here's a brief overview for investors ahead of the announcement.
Analysts anticipate Omnicom Group to report an earnings per share (EPS) of $2.16.
Omnicom Group bulls will hope to hear the company announce they've not only beaten that estimate, but also to provide positive guidance, or forecasted growth, for the next quarter.
New investors should note that it is sometimes not an earnings beat or miss that most affects the price of a stock, but the guidance (or forecast).
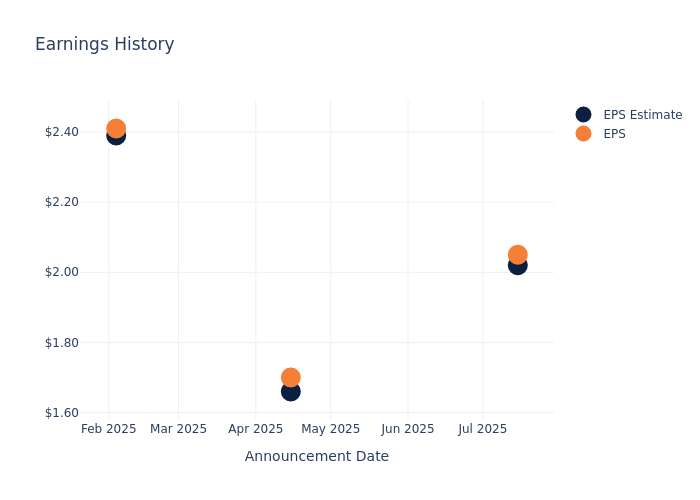
Earnings Track Record
In the previous earnings release, the company beat EPS by $0.03, leading to a 4.62% increase in the share price the following trading session.
Here's a look at Omnicom Group's past performance and the resulting price change:
| Quarter | Q2 2025 | Q1 2025 | Q4 2024 | Q3 2024 |
|---|---|---|---|---|
| EPS Estimate | 2.02 | 1.66 | 2.39 | 2.02 |
| EPS Actual | 2.05 | 1.70 | 2.41 | 2.03 |
| Price Change % | 5.00 | -7.00 | -2.00 | 1.00 |
Tracking Omnicom Group's Stock Performance
Shares of Omnicom Group were trading at $77.52 as of October 17. Over the last 52-week period, shares are down 22.5%. Given that these returns are generally negative, long-term shareholders are likely bearish going into this earnings release.
Insights Shared by Analysts on Omnicom Group
For investors, staying informed about market sentiments and expectations in the industry is paramount. This analysis provides an exploration of the latest insights on Omnicom Group.
Analysts have provided Omnicom Group with 1 ratings, resulting in a consensus rating of Outperform. The average one-year price target stands at $91.0, suggesting a potential 17.39% upside.
Understanding Analyst Ratings Among Peers
This comparison focuses on the analyst ratings and average 1-year price targets of The Interpublic Group, Trade Desk and NIQ Global Intelligence, three major players in the industry, shedding light on their relative performance expectations and market positioning.
- Analysts currently favor an Neutral trajectory for The Interpublic Group, with an average 1-year price target of $26.8, suggesting a potential 65.43% downside.
- Analysts currently favor an Neutral trajectory for Trade Desk, with an average 1-year price target of $74.19, suggesting a potential 4.3% downside.
- Analysts currently favor an Outperform trajectory for NIQ Global Intelligence, with an average 1-year price target of $23.0, suggesting a potential 70.33% downside.
Summary of Peers Analysis
The peer analysis summary outlines pivotal metrics for The Interpublic Group, Trade Desk and NIQ Global Intelligence, demonstrating their respective standings within the industry and offering valuable insights into their market positions and comparative performance.
| Company | Consensus | Revenue Growth | Gross Profit | Return on Equity |
|---|---|---|---|---|
| Omnicom Group | Outperform | 4.20% | $668.30M | 5.81% |
| The Interpublic Group | Neutral | -6.39% | $469.30M | 4.45% |
| Trade Desk | Neutral | 18.73% | $543.06M | 3.33% |
| NIQ Global Intelligence | Outperform | 5.58% | $591.60M | -28.48% |
Key Takeaway:
Omnicom Group ranks highest in Gross Profit and Return on Equity among its peers. It is in the middle for Revenue Growth.
Unveiling the Story Behind Omnicom Group
Omnicom is a holding company that owns several advertising agencies and related firms. It provides traditional and digital advertising services that include creative design, market research, data analytics, ad placement, and public relations. The firm operates globally, providing services in more than 70 countries; it generates more than one half of its revenue in North America and nearly 30% in Europe.
Omnicom Group's Economic Impact: An Analysis
Market Capitalization: Positioned above industry average, the company's market capitalization underscores its superiority in size, indicative of a strong market presence.
Positive Revenue Trend: Examining Omnicom Group's financials over 3 months reveals a positive narrative. The company achieved a noteworthy revenue growth rate of 4.2% as of 30 June, 2025, showcasing a substantial increase in top-line earnings. As compared to its peers, the revenue growth lags behind its industry peers. The company achieved a growth rate lower than the average among peers in Communication Services sector.
Net Margin: The company's net margin is a standout performer, exceeding industry averages. With an impressive net margin of 6.42%, the company showcases strong profitability and effective cost control.
Return on Equity (ROE): Omnicom Group's ROE surpasses industry standards, highlighting the company's exceptional financial performance. With an impressive 5.81% ROE, the company effectively utilizes shareholder equity capital.
Return on Assets (ROA): Omnicom Group's financial strength is reflected in its exceptional ROA, which exceeds industry averages. With a remarkable ROA of 0.91%, the company showcases efficient use of assets and strong financial health.
Debt Management: The company maintains a balanced debt approach with a debt-to-equity ratio below industry norms, standing at 1.58.
To track all earnings releases for Omnicom Group visit their earnings calendar on our site.
This article was generated by Benzinga's automated content engine and reviewed by an editor.