
The Analyst Verdict: Synchrony Financial In The Eyes Of 15 Experts
Providing a diverse range of perspectives from bullish to bearish, 15 analysts have published ratings on Synchrony Financial (NYSE:SYF) in the last three months.
The table below provides a concise overview of recent ratings by analysts, offering insights into the changing sentiments over the past 30 days and drawing comparisons with the preceding months for a holistic perspective.
| Bullish | Somewhat Bullish | Indifferent | Somewhat Bearish | Bearish | |
|---|---|---|---|---|---|
| Total Ratings | 3 | 7 | 5 | 0 | 0 |
| Last 30D | 1 | 1 | 0 | 0 | 0 |
| 1M Ago | 1 | 4 | 3 | 0 | 0 |
| 2M Ago | 1 | 0 | 0 | 0 | 0 |
| 3M Ago | 0 | 2 | 2 | 0 | 0 |
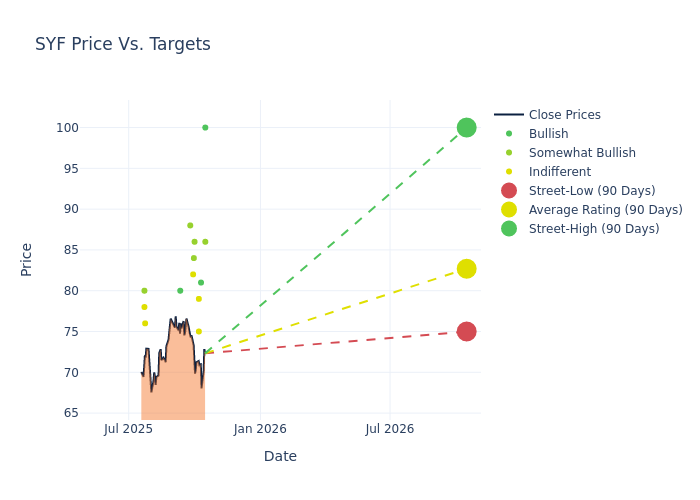
Analysts have recently evaluated Synchrony Financial and provided 12-month price targets. The average target is $82.53, accompanied by a high estimate of $100.00 and a low estimate of $75.00. This upward trend is evident, with the current average reflecting a 4.73% increase from the previous average price target of $78.80.
Diving into Analyst Ratings: An In-Depth Exploration
A clear picture of Synchrony Financial's perception among financial experts is painted with a thorough analysis of recent analyst actions. The summary below outlines key analysts, their recent evaluations, and adjustments to ratings and price targets.
| Analyst | Analyst Firm | Action Taken | Rating | Current Price Target | Prior Price Target |
|---|---|---|---|---|---|
| Terry Ma | Barclays | Raises | Overweight | $86.00 | $83.00 |
| Vincent Caintic | BTIG | Maintains | Buy | $100.00 | $100.00 |
| Saul Martinez | HSBC | Raises | Buy | $81.00 | $73.00 |
| Erika Najarian | UBS | Raises | Neutral | $79.00 | $78.00 |
| Richard Shane | JP Morgan | Lowers | Neutral | $75.00 | $80.00 |
| Terry Ma | Barclays | Raises | Overweight | $83.00 | $80.00 |
| Sanjay Sakhrani | Keefe, Bruyette & Woods | Raises | Outperform | $86.00 | $82.00 |
| John Pancari | Evercore ISI Group | Raises | Outperform | $84.00 | $83.00 |
| Jeff Adelson | Morgan Stanley | Raises | Equal-Weight | $82.00 | $72.00 |
| David M. Scharf | JMP Securities | Raises | Market Outperform | $88.00 | $77.00 |
| Mihir Bhatia | B of A Securities | Raises | Buy | $80.00 | $75.00 |
| Brian Foran | Truist Securities | Raises | Hold | $76.00 | $68.00 |
| Jon Arfstrom | RBC Capital | Raises | Sector Perform | $78.00 | $75.00 |
| Donald Fandetti | Wells Fargo | Raises | Overweight | $80.00 | $75.00 |
| Terry Ma | Barclays | Lowers | Overweight | $80.00 | $81.00 |
Key Insights:
- Action Taken: Analysts frequently update their recommendations based on evolving market conditions and company performance. Whether they 'Maintain', 'Raise' or 'Lower' their stance, it reflects their reaction to recent developments related to Synchrony Financial. This information provides a snapshot of how analysts perceive the current state of the company.
- Rating: Offering a comprehensive view, analysts assess stocks qualitatively, spanning from 'Outperform' to 'Underperform'. These ratings convey expectations for the relative performance of Synchrony Financial compared to the broader market.
- Price Targets: Analysts navigate through adjustments in price targets, providing estimates for Synchrony Financial's future value. Comparing current and prior targets offers insights into analysts' evolving expectations.
Navigating through these analyst evaluations alongside other financial indicators can contribute to a holistic understanding of Synchrony Financial's market standing. Stay informed and make data-driven decisions with our Ratings Table.
Stay up to date on Synchrony Financial analyst ratings.
Unveiling the Story Behind Synchrony Financial
Synchrony Financial, originally a spinoff of GE Capital's retail financing business, is the largest provider of private-label credit cards in the United States by both outstanding receivables and purchasing volume. Synchrony partners with other firms to market its credit products in their physical stores as well as on their websites and mobile applications. Synchrony operates through three segments: retail card (private-label and co-branded general-purpose credit cards), payment solutions (promotional financing for large ticket purchases), and CareCredit (financing for elective healthcare procedures).
Synchrony Financial: A Financial Overview
Market Capitalization Analysis: Above industry benchmarks, the company's market capitalization emphasizes a noteworthy size, indicative of a strong market presence.
Negative Revenue Trend: Examining Synchrony Financial's financials over 3M reveals challenges. As of 30 June, 2025, the company experienced a decline of approximately -1.75% in revenue growth, reflecting a decrease in top-line earnings. As compared to its peers, the revenue growth lags behind its industry peers. The company achieved a growth rate lower than the average among peers in Financials sector.
Net Margin: Synchrony Financial's financial strength is reflected in its exceptional net margin, which exceeds industry averages. With a remarkable net margin of 25.94%, the company showcases strong profitability and effective cost management.
Return on Equity (ROE): The company's ROE is a standout performer, exceeding industry averages. With an impressive ROE of 6.09%, the company showcases effective utilization of equity capital.
Return on Assets (ROA): The company's ROA is below industry benchmarks, signaling potential difficulties in efficiently utilizing assets. With an ROA of 0.78%, the company may need to address challenges in generating satisfactory returns from its assets.
Debt Management: Synchrony Financial's debt-to-equity ratio is below the industry average at 1.02, reflecting a lower dependency on debt financing and a more conservative financial approach.
The Significance of Analyst Ratings Explained
Ratings come from analysts, or specialists within banking and financial systems that report for specific stocks or defined sectors (typically once per quarter for each stock). Analysts usually derive their information from company conference calls and meetings, financial statements, and conversations with important insiders to reach their decisions.
Some analysts also offer predictions for helpful metrics such as earnings, revenue, and growth estimates to provide further guidance as to what to do with certain tickers. It is important to keep in mind that while stock and sector analysts are specialists, they are also human and can only forecast their beliefs to traders.
Breaking: Wall Street's Next Big Mover
Benzinga's #1 analyst just identified a stock poised for explosive growth. This under-the-radar company could surge 200%+ as major market shifts unfold. Click here for urgent details.
This article was generated by Benzinga's automated content engine and reviewed by an editor.